The following diagram shows a consumer's demand schedule for a good. At a price of $2, consumer surplus is:
Figure 6.4
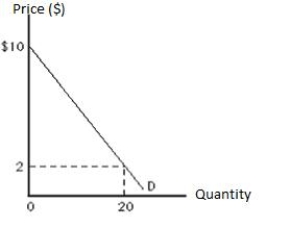
A) $4.
B) $5.
C) $10.
D) $80.
E) $200.
Correct Answer:
Verified
Q101: Consumer surplus is:
A)the amount by which quantity
Q102: The following diagram shows Ken's demand curve
Q103: The following diagram shows the demand curve
Q105: As price falls along the demand curve
Q107: The following diagram shows the demand curve
Q108: Suppose Debbie is willing to pay $50
Q110: The following diagram shows a market equilibrium.
Q111: The following image shows the demand curve
Q112: As price falls along the demand curve
Q144: The difference between the maximum amount a
Unlock this Answer For Free Now!
View this answer and more for free by performing one of the following actions

Scan the QR code to install the App and get 2 free unlocks

Unlock quizzes for free by uploading documents