Figure 5.9 shows three upward-sloping linear supply curves. Which of the following supply curves is the most elastic and which is the least elastic between the prices of $5 and $6? Figure 5.9
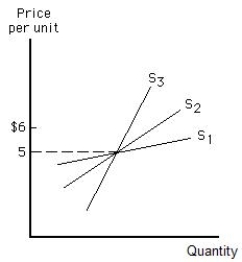
A) S1 is the most elastic; S2 is the least elastic.
B) S1 is the most elastic; S3 is the least elastic.
C) S3 is the most elastic; S1 is the least elastic.
D) S3 is the most elastic; S2 is the least elastic.
E) S2 is the most elastic; S3 is the least elastic.
Correct Answer:
Verified
Q123: Figure 5.10 shows two upward-sloping linear supply
Q129: Table 5.6 shows the change in the
Q131: Figure 5.10 shows two upward-sloping linear supply
Q133: In order to prove that macaroni is
Q142: Inferior goods have an income elasticity of
Q149: An inferior good is _
A)any good of
Q155: As the economy recovers from a recession,we
Q164: Economists distinguish between normal and inferior goods
Q183: Demand for a necessity, such as food,
Q188: Luxury goods are
A)price inelastic
B)income inelastic
C)income elastic
D)goods with
Unlock this Answer For Free Now!
View this answer and more for free by performing one of the following actions

Scan the QR code to install the App and get 2 free unlocks

Unlock quizzes for free by uploading documents