Figure 6-1 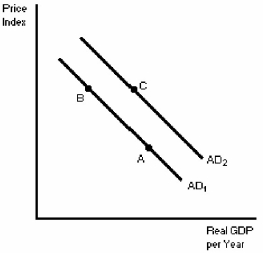
-In Figure 6-1,a movement from point B to point A can be explained by
A) an increase in the real value of cash balances.
B) a decrease in the real value of cash balances.
C) the decrease in interest rates.
D) the increase in exports to the foreign sector.
Correct Answer:
Verified
Q25: Figure 6-1 Q26: A rise in the price level will Q28: The aggregate demand curve usually Q29: The horizontal axis for an aggregate demand Q31: Higher interest rates Q32: If other factors are held constant,an increase Q33: When prices increase the interest rate effect Q34: The vertical axis for an aggregate demand Q35: Other things equal,a higher price level is Q139: If you have $5000 and the GDP![]()
A)is vertical.
B)slopes upward.
C)slopes
A)reduce the quantity of goods
A)will
Unlock this Answer For Free Now!
View this answer and more for free by performing one of the following actions

Scan the QR code to install the App and get 2 free unlocks

Unlock quizzes for free by uploading documents