Figure 6-1 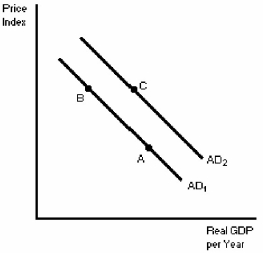
-In Figure 6-1,a movement from point A to point B can be explained by
A) an increase in spending due to a war.
B) an increase in the price level.
C) an increase in the demand for manufacturing goods due to new technology.
D) a drop in the price level.
Correct Answer:
Verified
Q9: The aggregate demand curve gives the
A)planned purchases
Q11: The aggregate demand curve shows that,if other
Q12: Over time in a growing economy,the long-run
Q13: Figure 6-1 Q16: The aggregate demand curve plots Q17: When the price level goes down,the aggregate Q18: At each price level,the aggregate demand curve Q19: Other things constant,the economy's aggregate demand curve Q45: Economic growth can be thought of as Q58: The long-run aggregate supply curve can be![]()
A)desired expenditures against
A)
Unlock this Answer For Free Now!
View this answer and more for free by performing one of the following actions

Scan the QR code to install the App and get 2 free unlocks

Unlock quizzes for free by uploading documents