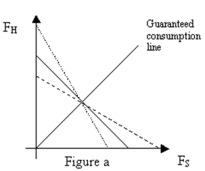
-Refer to Figure a.Assuming the bold line in the graph above is a constant expected consumption line where  ,which constant expected consumption line reflects an increase in
  ?
?
A) Dotted line
B) Dashed line
C) An increase in does not result in an change in the expected consumption line
D) A change in results in a parallel shift in the expected consumption line, so neither the red or green line reflects this change
Correct Answer:
Verified
Q2: Suppose Alice is deciding whether or not
Q12: What is the risk premium of the
Q13: What is the expected payoff of an
Q13: What is the risk premium for the
Q14: Q15: Q18: What is the certainty equivalent of the Q20: Suppose Brandon's indifference curves are defined as Q21: Assume Brandon's benefit function for water is Q22: Unlock this Answer For Free Now! View this answer and more for free by performing one of the following actions Scan the QR code to install the App and get 2 free unlocks Unlock quizzes for free by uploading documents![]()
![]()
![]()

