Multiple Choice
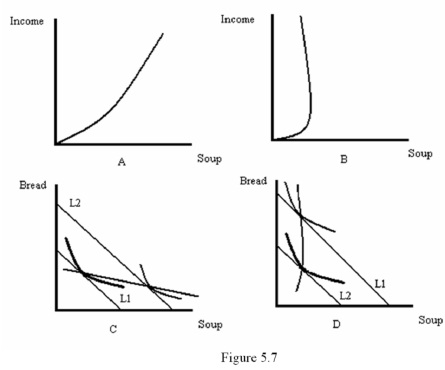
-Refer to Figure 5.7.Which diagram best represents an Engle curve where soup is a normal good?
A) A
B) B
C) C
D) D
Correct Answer:
Verified
Related Questions
Q39: An affordable consumption bundle is an interior
Q40: Mike's income is $450 per month.He spends
Q41: If a good is normal,then the Engel
Q42: A curve that shows how the best
Q43: If the income-consumption path slopes down,then
A) Both
Q45: If an increase in the price of
Unlock this Answer For Free Now!
View this answer and more for free by performing one of the following actions

Scan the QR code to install the App and get 2 free unlocks

Unlock quizzes for free by uploading documents