Multiple Choice
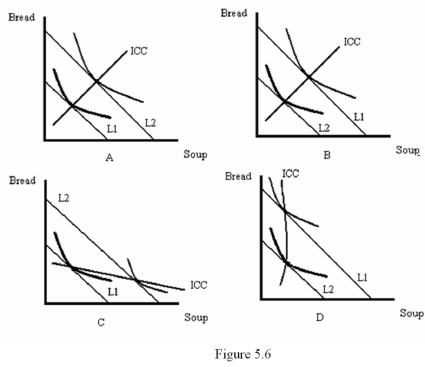
-Refer to Figure 5.6.Which diagram shows a decrease in income with bread being normal and soup being inferior?
A) A
B) B
C) C
D) D
Correct Answer:
Verified
Related Questions
Q55: Which of the following statements is true?
A)
Q55: Suppose that books are measured on the
Q56: When a good is normal,
A) An increase
Q57: If a change in the price of
Unlock this Answer For Free Now!
View this answer and more for free by performing one of the following actions

Scan the QR code to install the App and get 2 free unlocks

Unlock quizzes for free by uploading documents