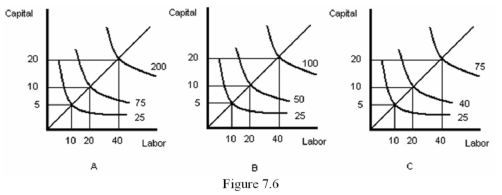
-Refer to Figure 7.6.Which graph represents constant returns to scale?
A) A
B) B
C) C
D) Both graph A and graph C
Correct Answer:
Verified
Q24: _ identifies all of the input combinations
Q36: _ are resources that are fully used
Q39: Q40: Isoquants are the _ created by the Q41: Two inputs _ when they must be Q43: Which of the following statements regarding comparisons Q44: With _ returns to scale,production is most Q45: From 1970 to 1984,the productivity of the Q46: One reason that firms will experience increasing Q47: The productivity changes resulting from research and![]()
Unlock this Answer For Free Now!
View this answer and more for free by performing one of the following actions

Scan the QR code to install the App and get 2 free unlocks

Unlock quizzes for free by uploading documents