The graph shows the number of visitors V to a national park in hundreds of thousands during a one-year period,where  represents January.Estimate the rate of change of V over the interval
  Round your answer to the nearest hundred thousand visitors per year.
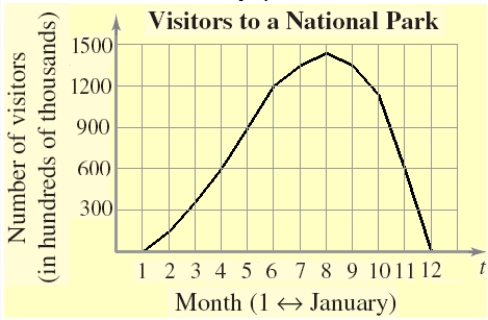
A) 187.5 hundred thousand visitors per year
B) 281.25 hundred thousand visitors per year
C) 225 hundred thousand visitors per year
D) 562.5 hundred thousand visitors per year
E) 1125 hundred thousand visitors per year
Correct Answer:
Verified
Q16: Find the slope of the tangent line
Q17: Find the derivative of the following function
Q18: Differentiate the given function. 
Q19: Find the derivative of the following function
Q20: Use the limit definition to find the
Q22: The population P ( in thousands)of Japan
Q23: The cost C (in dollars)of producing x
Q24: A population of bacteria is introduced into
Q25: Find the point(s),if any,at which the graph
Q26: Use the demand function ![]()
Unlock this Answer For Free Now!
View this answer and more for free by performing one of the following actions

Scan the QR code to install the App and get 2 free unlocks

Unlock quizzes for free by uploading documents