The following figure shows the daily three-month treasury yield in September 2008. Refer to the following figure when answering the following questions.
Figure 10.1: Daily Three-Month Treasury Yield: September 2008 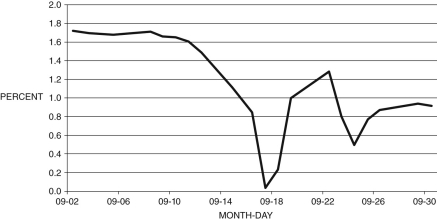
-Consider the data in Figure 10.1. What event precipitated the change in the yield in mid-September?
A) the expanded trade deficit with China
B) the election of Barack Obama
C) the bankruptcy of Lehman Brothers
D) the Greek fiscal crisis
E) the continuing Japanese recession
Correct Answer:
Verified
Q59: In terms of loss of employment, which
Q60: One of the key differences between the
Q61: In 1933, the _ was established to
Q62: When a bank's assets cannot cover its
Q63: Net worth is equal to a bank's:
A)
Q65: If reserve requirements are 3 percent and
Q66: In the recent financial crisis, the banks'
Q67: What is the industry Mr. McGuire advises
Q68: In the months following the collapse of
Q69: When the investment bank Bear Stearns collapsed,
Unlock this Answer For Free Now!
View this answer and more for free by performing one of the following actions

Scan the QR code to install the App and get 2 free unlocks

Unlock quizzes for free by uploading documents