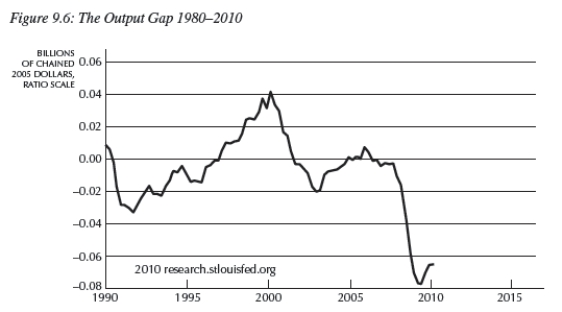
-Figure 9.6 below shows the output gap for the years 1990-2010.Using the Phillips curve and Okun's law,discuss the impacts on inflation and unemployment for the years 1997-2000 and 2008-2010.From this analysis,what is the relationship between unemployment and inflation?
Correct Answer:
Verified
View Answer
Unlock this answer now
Get Access to more Verified Answers free of charge
Q80: You are a staff economist with the
Q83: If output is above potential,so that
Q84: Q86: Suppose an economy exhibits a large unexpected Q88: Suppose an economy's natural rate of unemployment Q101: What three premises does the short-run model Q103: An increase in planned investment expenditures is Q106: A country with a steep Phillips curve Q110: What does the Phillips curve represent? Q113: When current output rises above potential output,![]()
Unlock this Answer For Free Now!
View this answer and more for free by performing one of the following actions

Scan the QR code to install the App and get 2 free unlocks

Unlock quizzes for free by uploading documents