The following graph indicates which type of cost behaviour? 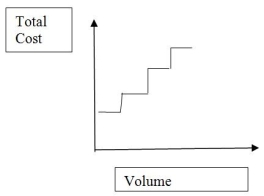
A) Fixed
B) Mixed
C) Step
D) Variable
Correct Answer:
Verified
Q60: The equation for a straight line is
Q61: If a company's overhead cost equation is
Q62: The following graphs indicate which type of
Q63: In the equation: y = vx +
Q64: Total fixed costs for Excelsior Corporation are
Q66: In the equation y = $9.90x +
Q67: Total fixed costs for Yellow Boats Inc.
Q68: The representation for fixed cost per unit
Q69: Total costs for Watson & Company at
Q70: YouCall offers a calling plan that charges
Unlock this Answer For Free Now!
View this answer and more for free by performing one of the following actions

Scan the QR code to install the App and get 2 free unlocks

Unlock quizzes for free by uploading documents