The following chart shows three different costs: Cost A, Cost B, Cost C. For each cost, the chart shows the total cost and cost per unit at two different volumes within the same relevant range. Based on this information, identify each cost as fixed, variable or mixed. 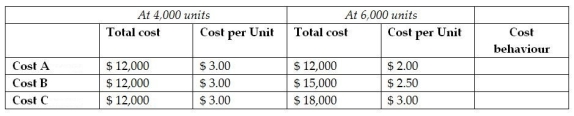
Correct Answer:
Verified
Q35: Selected financial data for Flash Corporation follows
Q36: Which of the following is a characteristic
Q37: The following chart shows three different costs:
Q38: Jensen Ltd. reports the following information for
Q39: Which of the following statements is TRUE
Q41: Which of the following cost behaviours cannot
Q43: At any given volume, average fixed costs
Q43: The equation for total fixed costs is
A)
Q44: If production increases by 15%, how will
Q45: Total variable costs can be expressed as
Unlock this Answer For Free Now!
View this answer and more for free by performing one of the following actions

Scan the QR code to install the App and get 2 free unlocks

Unlock quizzes for free by uploading documents