Figure 1-1 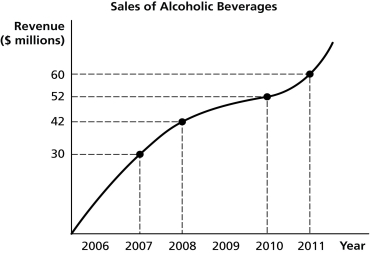
-Refer to Figure 1-1. Using the information in the figure above, calculate the percentage change in sales of alcoholic beverages between 2007 and 2011.
A) 30%
B) 50%
C) 66.7%
D) 100%
Correct Answer:
Verified
Q201: If the price of milk was $1.25
Q206: If the price of pineapple juice was
Q212: Suppose when the price of hybrid automobiles
Q217: On a two-dimensional graph, _ allows for
Q223: You explain to your roommate Surya, who
Q229: What is the "omitted variable" problem in
Q233: At a recent company meeting, Ravi Batra,
Q234: The relationship between consumer spending and disposable
Q414: Suppose when the price of laptops falls,
Q418: Figure 1-1 ![]()
Unlock this Answer For Free Now!
View this answer and more for free by performing one of the following actions

Scan the QR code to install the App and get 2 free unlocks

Unlock quizzes for free by uploading documents