Table 11-4
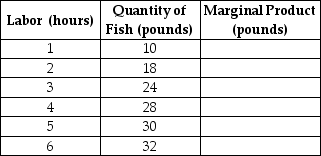
-Refer to Table 11-4. The table above shows the following relationship between hours spent fishing and the quantity of fish caught for Juan, a commercial fisherman.a. Complete the Marginal Product column in Table 11-4.
b. Characterize the production function, i.e. does the production function display increasing marginal returns, diminishing marginal returns, etc.
c. Using the data above, graph Juan's marginal product curve. Be sure to label the horizontal and vertical axes. Is your graph consistent with your answer to part (b)? Explain.
d. Juan uses the following inputs for fishing - a small wooden boat (B), a fishing pole (P) and of course, his labor (L). Treating the boat and the fishing pole as fixed inputs and using the data above, graph Juan's Total Product of Labor curve. Be sure to label the horizontal and vertical axes.
e. (Extra Credit) The opportunity cost of Juan's time is $8 per hour. If Juan receives $2 per pound for his fish, what is the optimal number of hours he should spend fishing? Explain how you arrived at your answer. Hint: Recall marginal benefit and marginal cost analysis.
Correct Answer:
Verified
View Answer
Unlock this answer now
Get Access to more Verified Answers free of charge
Q130: State the law of diminishing marginal returns.
Q142: If the 15th unit of output has
Q143: Marginal cost is calculated for a particular
Q150: Which of the following costs will not
Q151: Fill in the missing values in the
Q151: The change in a firm's total cost
Q155: Jill Johnson owns a pizzeria.She currently produces
Q156: The shape of the average total cost
Q159: Damian owns a tattoo parlor and has
Q160: When a firm produces 50,000 units of
Unlock this Answer For Free Now!
View this answer and more for free by performing one of the following actions

Scan the QR code to install the App and get 2 free unlocks

Unlock quizzes for free by uploading documents