Table 19-23
2007 2013
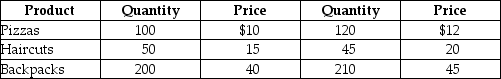
-Refer to Table 19-23. Suppose that a very simple economy produces three goods: pizzas, haircuts, and backpacks. Suppose the quantities produced and their corresponding prices for 2007 and 2013 are shown in the table above. Use the information to compute real GDP in the year 2007 and 2013. Assume that 2007 is the base year. Is output higher in 2013 or 2007? Why?
Correct Answer:
Verified
View Answer
Unlock this answer now
Get Access to more Verified Answers free of charge
Q222: Q222: A country in which a significant fraction Q226: The output of U.S.citizens who work in Q230: Suppose that in 2013,the national income in Q232: Table 19-26 Q232: National income equals gross national product minus Q233: The best measure of the income households Q234: The value of what a U.S.-owned McDonald's Q237: National income equals gross domestic product Q238: Disposable personal income equals personal income
![]()
A)imports.
B)depreciation.
C)inventories.
D)changes
A)plus sales
A)minus personal
Unlock this Answer For Free Now!
View this answer and more for free by performing one of the following actions

Scan the QR code to install the App and get 2 free unlocks

Unlock quizzes for free by uploading documents