Multiple Choice
Table 20-19
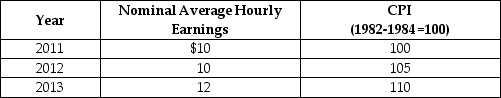
-Refer to Table 20-19. Looking at the table above, what is the rate of growth of the average price level from 2012 to 2013?
A) 1%
B) 2%
C) 3.5%
D) 4.76%
E) 5.25%
Correct Answer:
Verified
Related Questions
Q225: Table 20-19 Q227: Table 20-21 Q228: Table 20-19 Q229: The nominal interest rate equals the real Q229: Table 20-17 Q230: Imagine that you borrow $1,000 for one Q231: Imagine that you borrow $5,000 for one Unlock this Answer For Free Now! View this answer and more for free by performing one of the following actions Scan the QR code to install the App and get 2 free unlocks Unlock quizzes for free by uploading documents
![]()
![]()
![]()
![]()

