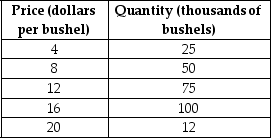
Use the following supply schedule for cherries to draw a graph of the supply curve.Be sure to label the supply curve and each axis,and show each point on the supply curve.
Correct Answer:
Verified
Q122: Figure 3-4 Q126: An increase in the price of inputs Q128: Explain the differences between a change in Q130: All else equal, as the price of Q132: A decrease in quantity supplied is represented Q135: What is the difference between a supply Q136: Which of the following is the correct Q137: From a supply perspective, what impact would Q138: Figure 3-4 Q246: Figure 3-3 Unlock this Answer For Free Now! View this answer and more for free by performing one of the following actions Scan the QR code to install the App and get 2 free unlocks Unlock quizzes for free by uploading documents
![]()
![]()
![]()

