Exhibit 3.5
The following questions are based on this problem and accompanying Excel windows.
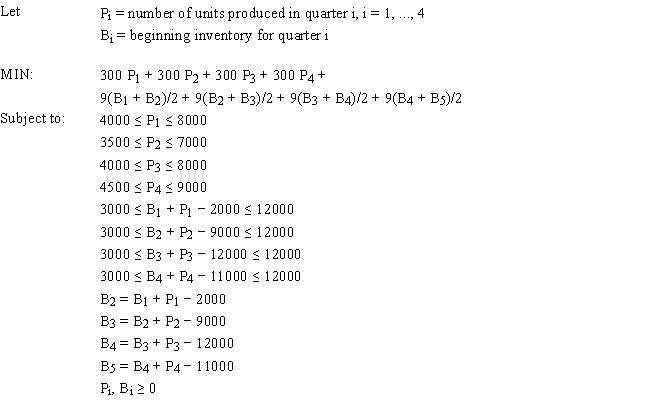
A company is planning production for the next 4 quarters. They want to minimize the cost of production. The production cost is stable but demand and production capacity vary from quarter to quarter. The maximum amount of inventory which can be held is 12,000 units and management wants to keep at least 3,000 units on hand. Quarterly inventory holding cost is 3% of the cost of production. The company estimates the number of units carried in inventory each month by averaging the beginning and ending inventory for each month. There are currently 5,000 units in inventory. The company wants to produce at no less than one half of its maximum capacity in any quarter. 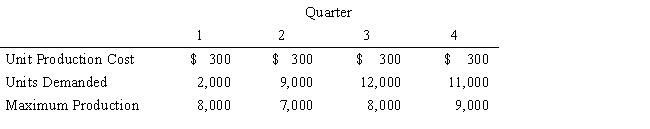
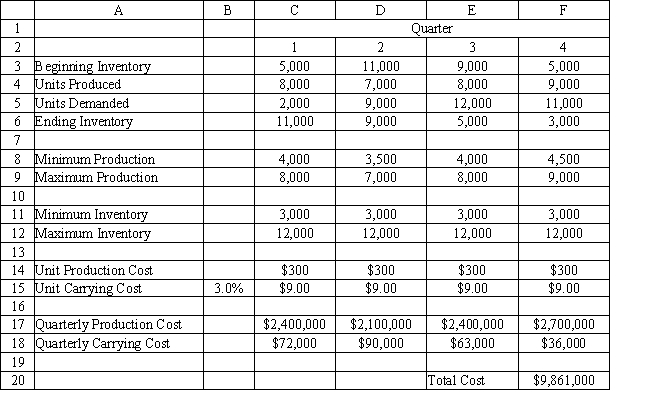
-Refer to Exhibit 3.5. What formula could be entered in cell F20 in the accompanying Excel spreadsheet to compute the Total Cost for all four quarters?
A) SUMPRODUCT($C$4:$F$4,C17:F17)
B) SUM(C17:F17) + SUM(C18:F18)
C) PRODUCT(SUM(C14:F15,C17:F18)
D) SUMPRODUCT(C4:F4,C14:F14) + SUMPRODUCT(C6:F6,C15:F15)
Correct Answer:
Verified
Q22: How many constraints are there in a
Q23: Exhibit 3.3
The following questions are based on
Q24: In the Analytic Solver Platform dialog box
Q25: Spreadsheet modeling is an acquired skill because
A)
Q26: Exhibit 3.3
The following questions are based on
Q28: Numeric constants should be
A) embedded in formulas.
B)
Q29: The "Analyze Without Solving" tool in Analytic
Q30: Exhibit 3.4
The following questions are based on
Q31: Exhibit 3.1
The following questions are based on
Q32: How many decision variables are there in
Unlock this Answer For Free Now!
View this answer and more for free by performing one of the following actions

Scan the QR code to install the App and get 2 free unlocks

Unlock quizzes for free by uploading documents