Exhibit 3.5
The following questions are based on this problem and accompanying Excel windows.
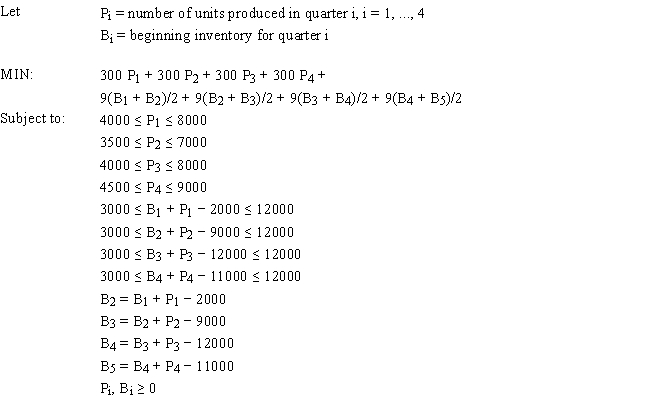
A company is planning production for the next 4 quarters. They want to minimize the cost of production. The production cost is stable but demand and production capacity vary from quarter to quarter. The maximum amount of inventory which can be held is 12,000 units and management wants to keep at least 3,000 units on hand. Quarterly inventory holding cost is 3% of the cost of production. The company estimates the number of units carried in inventory each month by averaging the beginning and ending inventory for each month. There are currently 5,000 units in inventory. The company wants to produce at no less than one half of its maximum capacity in any quarter. 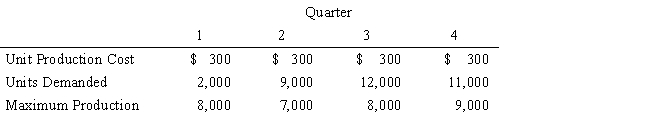
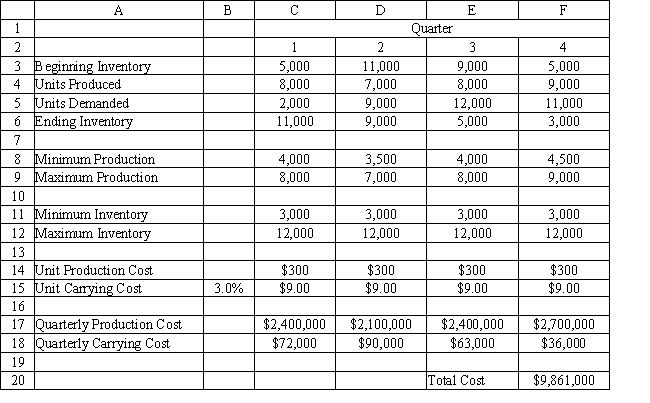
-Refer to Exhibit 3.5. What formula should be entered in cell C18 in the accompanying Excel spreadsheet to compute the quarterly carrying costs?
A) =C15*C3+C6
B) =C15*(C3+C6)
C) =C15*C3/2
D) =C15*(C3+C6) /2
Correct Answer:
Verified
Q4: Which type of spreadsheet cell represents the
Q5: Decision variables are sometimes referred to as
Q6: Solving LP problems in Excel requires only
Q7: Using Data Envelopment Analysis (DEA) for an
Q8: Exhibit 3.3
The following questions are based on
Q10: What does the Excel "=SUMPRODUCT(A1:A5,C6;C10)" function do?
A)
Q11: Analytic Solver Platform (ASP) is functionally similar
Q12: What action is required to make Analytic
Q13: Models which are setup in an intuitively
Q14: Bounds on the decision variables are known
Unlock this Answer For Free Now!
View this answer and more for free by performing one of the following actions

Scan the QR code to install the App and get 2 free unlocks

Unlock quizzes for free by uploading documents