The following graph of a time-series data suggests a ___ trend. 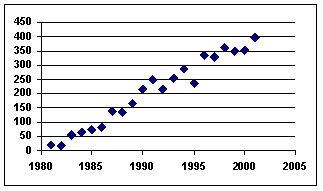
A) linear
B) quadratic
C) cosine
D) tangential
E) flat
Correct Answer:
Verified
Q30: The forecast value for September was
Q54: Analysis of data for an autoregressive forecasting
Q55: Fitting a linear trend to 36 monthly
Q57: The ratios of "actuals to moving averages"
Q58: The ratios of "actuals to moving averages"
Q60: Using a three-month moving average (with weights
Q61: Using 2000 as the base year,the 1990
Q62: Using 2008 as the base year,the 2007
Q63: The motivation for using an index number
Q66: Index numbers facilitate comparison of _.
A)means
B)data over
Unlock this Answer For Free Now!
View this answer and more for free by performing one of the following actions

Scan the QR code to install the App and get 2 free unlocks

Unlock quizzes for free by uploading documents