The figure below shows the market equilibrium (point B) at the intersection of demand and supply curves under perfect competition.Figure 11.5
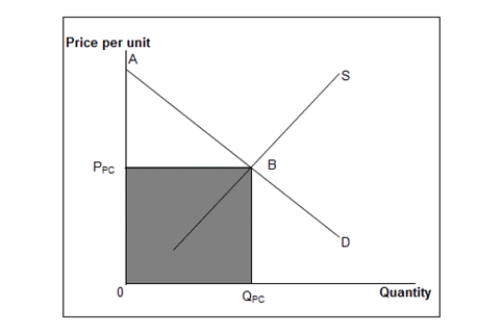 D: Market demand curve
S: Market supply curve
-The efficiency loss that occurs when a market is monopolized is known as:
A) a deadweight loss.
B) an inventory loss.
C) an economic loss.
D) a non-economic loss.
E) a capital loss.
Correct Answer:
Verified
Q74: The figure given below shows the demand
Q75: The figure below shows the market equilibrium
Q76: The following figures show the demand and
Q77: The figure given below shows the demand
Q78: The figure given below shows the demand
Q80: The following figures show the demand and
Q81: The figure given below shows the cost
Q82: The figure given below shows the cost
Q83: The figure given below shows the cost
Q84: The figure given below shows the cost
Unlock this Answer For Free Now!
View this answer and more for free by performing one of the following actions

Scan the QR code to install the App and get 2 free unlocks

Unlock quizzes for free by uploading documents