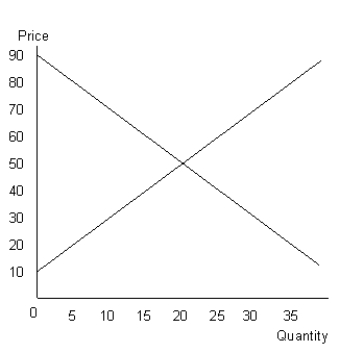
The figure given below shows the aggregate demand and supply curves of a perfectly competitive market.Figure 10.7

-A local monopoly is a firm that:
A) is the sole supplier of a good, without substitutes, in a specific geographic area.
B) is one of the suppliers of a good in a specific geographic area.
C) supplies all the products needed by consumers in a country.
D) produces to meet the requirement of only one consumer.
E) is one of the suppliers of a good that has a lot of substitutes, in a specific geographic area.
Correct Answer:
Verified
Q11: The figure given below shows the aggregate
Q12: The figure given below shows the aggregate
Q13: The figure given below shows the aggregate
Q14: The figure given below shows the aggregate
Q15: The figure given below shows the aggregate
Q17: The figure given below shows the aggregate
Q18: The figure given below shows the aggregate
Q19: The figure given below shows the aggregate
Q20: The figure given below shows the aggregate
Q21: The table given below shows the prices
Unlock this Answer For Free Now!
View this answer and more for free by performing one of the following actions

Scan the QR code to install the App and get 2 free unlocks

Unlock quizzes for free by uploading documents