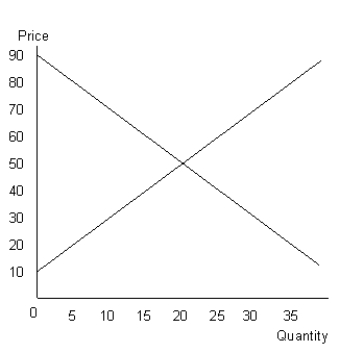
The figure given below shows the aggregate demand and supply curves of a perfectly competitive market.Figure 10.7

-If losses are incurred in a competitive industry, then over the long-run we can expect a greater quantity supplied, because market price will rise.
Correct Answer:
Verified
Q125: The figure given below shows the aggregate
Q126: The figure given below shows the aggregate
Q127: The figure given below shows the aggregate
Q128: The figure given below shows the aggregate
Q129: The figure given below shows the aggregate
Q130: The figure given below shows the aggregate
Q131: The figure given below shows the aggregate
Q132: The figure given below shows the aggregate
Q133: The figure given below shows the aggregate
Q135: The figure given below shows the aggregate
Unlock this Answer For Free Now!
View this answer and more for free by performing one of the following actions

Scan the QR code to install the App and get 2 free unlocks

Unlock quizzes for free by uploading documents