The figure given below shows the cost curves of a firm.Figure 9.3
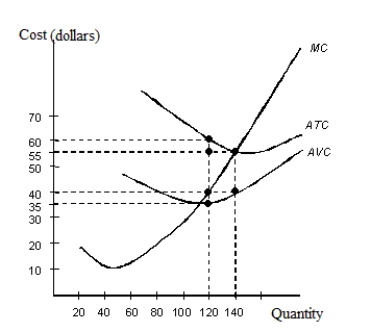 ATC: Average Total Cost
AVC: Average Variable Cost
MC: Marginal Cost
-In Figure 9.3, if the marginal revenue of the firm is constant at $55, calculate the profit earned by the firm at the profit-maximizing level of output?
A) $35
B) $40
C) $600
D) $4,800
E) $0
Correct Answer:
Verified
Q37: The table given below reports the marginal
Q38: The table given below reports the marginal
Q39: The table given below reports the marginal
Q40: The table given below reports the marginal
Q41: The figure given below shows the revenue
Q43: The figure given below shows the revenue
Q44: The figure given below shows the cost
Q45: The figure given below shows the revenue
Q46: The figure given below shows the revenue
Q47: The figure given below shows the revenue
Unlock this Answer For Free Now!
View this answer and more for free by performing one of the following actions

Scan the QR code to install the App and get 2 free unlocks

Unlock quizzes for free by uploading documents