The following graph shows the demand and cost curves of an imperfectly competitive firm. MC and ATC represent the marginal cost curve and the average cost curve respectively.Figure 9.1
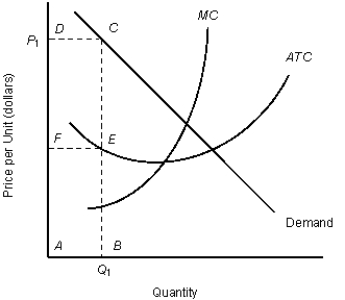
-Refer to Figure 9.1. At price P1, the firm sells quantity Q1, and total revenue is shown by:
A) the rectangle ABCD.
B) the rectangle ABEF.
C) the rectangle FECD.
D) the distance AB.
E) the distance BC.
Correct Answer:
Verified
Q16: The table given below shows the total
Q17: The table given below shows the total
Q18: The table given below reports the marginal
Q19: The table given below reports the marginal
Q20: The table given below reports the marginal
Q22: The table given below reports the marginal
Q23: The table given below reports the marginal
Q24: The table given below reports the marginal
Q25: The table given below reports the marginal
Q26: The following graph shows the demand and
Unlock this Answer For Free Now!
View this answer and more for free by performing one of the following actions

Scan the QR code to install the App and get 2 free unlocks

Unlock quizzes for free by uploading documents