The figure given below shows the average fixed cost (AFC) and the average variable cost (AVC) curves of a competitive firm.Figure 8.1
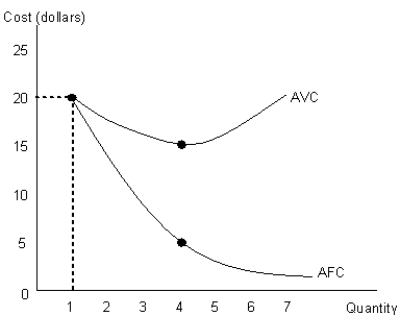
-Refer to Figure 8.1. Compute the total cost of producing 4 units of the output.
A) $64
B) $72
C) $80
D) $84
E) $90
Correct Answer:
Verified
Q29: The following table shows the cost of
Q30: The following table shows the cost of
Q31: The below figure shows the various combinations
Q32: The below figure shows the various combinations
Q33: The table below shows the total cost
Q35: The table below shows the total cost
Q36: The following table shows the cost of
Q37: The following table shows the cost of
Q38: The figure given below shows cost curves
Q39: The table below shows the total cost
Unlock this Answer For Free Now!
View this answer and more for free by performing one of the following actions

Scan the QR code to install the App and get 2 free unlocks

Unlock quizzes for free by uploading documents