The below indifference map shows the various combinations of hours of music and apples that yield different levels of utility.Figure 7.1
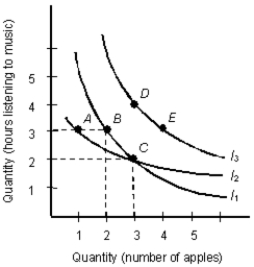
-According to indifference curve I1 in Figure 7.1, for each extra apple the consumer eats, he or she must simultaneously sacrifice ____ of listening to music to keep total utility constant.
A) 1 hour
B) 2 hours
C) 3 hours
D) 4 hours
E) 5 hours
Correct Answer:
Verified
Q84: The table below shows the total utility
Q85: The table below shows the total utility
Q86: The below indifference map shows the various
Q87: The table below shows the total utility
Q88: The below indifference map shows the various
Q90: The table below shows the total utility
Q91: The table below shows the total utility
Q92: The table below shows the total utility
Q93: The table below shows the total utility
Q94: The below indifference map shows the various
Unlock this Answer For Free Now!
View this answer and more for free by performing one of the following actions

Scan the QR code to install the App and get 2 free unlocks

Unlock quizzes for free by uploading documents