In the figure given below, D1 and S1 are the original demand and supply curves.Figure 3.1
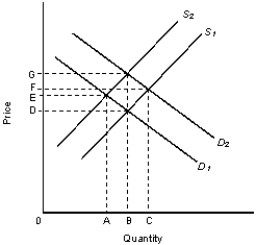
-Refer to Figure 3.1. Given D1, if supply moves from S1 to S2 it implies:
A) quantity supplied has increased.
B) demand will decrease from B to A.
C) a surplus will exist equal to AB.
D) supply has decreased, and equilibrium price and equilibrium quantity will move to G and B respectively.
E) supply has decreased, and equilibrium price and equilibrium quantity will move to E and A respectively.
Correct Answer:
Verified
Q45: The table given below reports the quantity
Q46: The table given below reports the quantity
Q47: The table given below reports the quantity
Q48: In the figure given below, D1 and
Q49: In the figure given below, D1 and
Q51: The below figure shows the demand and
Q52: The table given below represents the supply
Q53: The table given below represents the supply
Q54: The table given below represents the supply
Q55: The figure given below represents the equilibrium
Unlock this Answer For Free Now!
View this answer and more for free by performing one of the following actions

Scan the QR code to install the App and get 2 free unlocks

Unlock quizzes for free by uploading documents