The graph below is Mendork's production possibility curve for the only two goods that it produces-quirks and quarks.
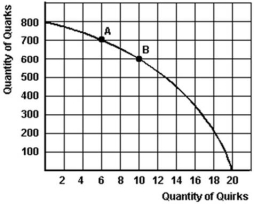
-Refer to the graph above to answer this question.If Mendork's current production is at point A,what is the (approximate) cost of producing one more quirk?
A) 100 quarks.
B) 50 quarks.
C) 25 quarks.
D) 200 quarks.
E) One more quark.
Correct Answer:
Verified
Q34: Which of the following would best describe
Q35: The fact that the typical movie theatre
Q36: Which of the following statements describes the
Q37: Ensuring the right type of products are
Q38: The graph below is Mendork's production possibility
Q40: Which of the following statements concerning capitalism
Q41: Below is a production possibilities curve for
Q42: Below is a production possibilities curve for
Q43: Below is a production possibilities curve for
Q44: Below is a production possibilities curve for
Unlock this Answer For Free Now!
View this answer and more for free by performing one of the following actions

Scan the QR code to install the App and get 2 free unlocks

Unlock quizzes for free by uploading documents