The figure given below shows the aggregate demand curve and the short-run aggregate supply curve of an economy.In this figure,short-run equilibrium occurs at: Figure 15.4
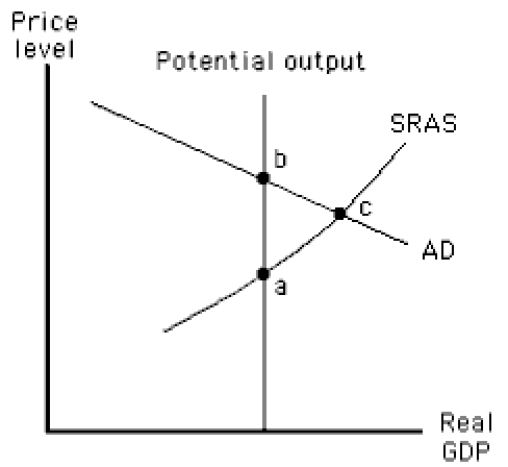
A) point b,where actual output exceeds potential output.
B) point a,where actual output exceeds potential output.
C) point c,where actual price level exceeds the expected price level.
D) point c,where the actual price level is less than the expected price level.
E) point b,where the actual price level exceeds the expected price level.
Correct Answer:
Verified
Q82: When the short-run aggregate supply curve is
Q83: The velocity of money in circulation measures:
A)the
Q84: According to the equation of exchange,if nominal
Q87: If the short-run aggregate supply curve is
Q88: If the money supply is $1,000,the price
Q90: Which of the following is true of
Q92: For a given increase in aggregate demand,the
Q94: Over the past 40 years,the most frequent
Q98: If the money supply in an economy
Q100: The Fed uses the federal funds rate
Unlock this Answer For Free Now!
View this answer and more for free by performing one of the following actions

Scan the QR code to install the App and get 2 free unlocks

Unlock quizzes for free by uploading documents