The figure given below shows equilibrium in a money market.If S is the supply curve,the equilibrium interest rate and quantity of money will be: Figure 15.2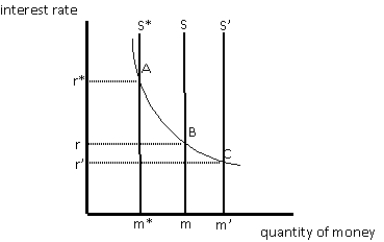
A) r and m,respectively.
B) r* and m*,respectively.
C) r' and m',respectively.
D) r and m',respectively.
E) r' and m*,respectively.
Correct Answer:
Verified
Q28: Which of the following changes is most
Q41: When the Fed adopts an expansionary monetary
Q46: Which of the following policies can be
Q47: In the aggregate demand-aggregate supply model in
Q49: All other things constant,if the interest rate
Q52: If the Fed decreases the money supply,gross
Q54: If the Fed increases the money supply,then:
A)the
Q59: In the short run,a decrease in the
Q70: The figure given below shows equilibrium in
Q77: The figure given below shows equilibrium in
Unlock this Answer For Free Now!
View this answer and more for free by performing one of the following actions

Scan the QR code to install the App and get 2 free unlocks

Unlock quizzes for free by uploading documents