The figure below shows the determination of the equilibrium price level and real GDP in an aggregate demand-aggregate supply model.If the economy is at point H,there is a(n) :
Figure 10.7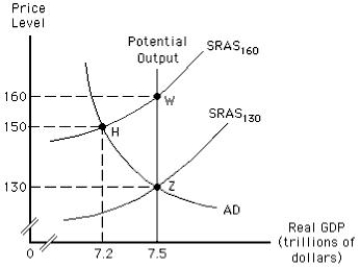
A) expansionary gap of $300 billion.
B) recessionary gap of $300 billion.
C) recessionary gap of $10 billion.
D) expansionary gap of $20 billion.
E) expansionary gap of $10 billion.
Correct Answer:
Verified
Q80: As actual output falls below the potential
Q81: In the long run,an economy will produce
Q82: Which of the following is true when
Q85: An increase in aggregate demand in the
Q86: Which of the following is true of
Q88: If resource prices are "sticky" downward and
Q91: In the long run,a decrease in aggregate
Q92: A recessionary gap is usually closed in
Q99: When resource prices are negotiable,the long-run aggregate
Q112: The figure below shows short-run equilibrium in
Unlock this Answer For Free Now!
View this answer and more for free by performing one of the following actions

Scan the QR code to install the App and get 2 free unlocks

Unlock quizzes for free by uploading documents