The figure shows the determination of thr equilibrium price level and real GDP in an aggregate demand-aggregate supply model.Which of the following economic changes is depicted by a movement from point e to point e'?
Figure 10.6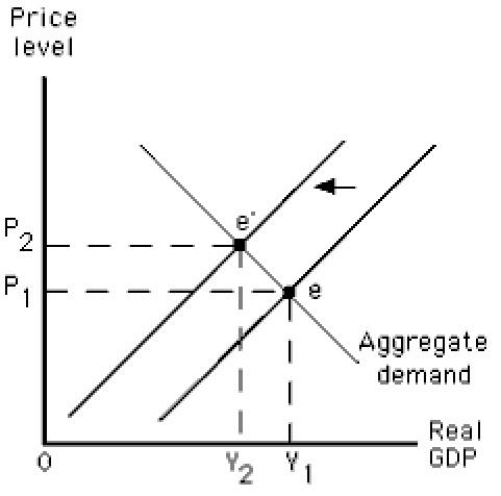
A) An increase in short-run aggregate supply
B) An increase in long-run aggregate supply
C) A decrease in short-run aggregate supply
D) A decrease in long-run aggregate supply
E) An increase in the aggregate quantity demanded
Correct Answer:
Verified
Q83: Which of the following does not influence
Q89: In the long run,the price level in
Q90: In 2009,actual output in the U.S.was 4.7
Q94: Which of these changes is observed in
Q95: Which of the following is generally true
Q101: Which of the following is true of
Q108: Which of these is most likely to
Q113: The main effect of an increase in
Q118: The figure below shows short-run equilibrium in
Q125: The figure given below depicts long run
Unlock this Answer For Free Now!
View this answer and more for free by performing one of the following actions

Scan the QR code to install the App and get 2 free unlocks

Unlock quizzes for free by uploading documents