The figure below shows equilibrium in an aggregate demand-aggregate supply model.In this figure,the shift from AS to AS' is likely to occur when:
Figure 10.3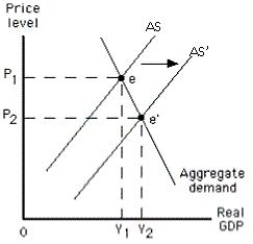
A) the actual price level is higher than expected.
B) the actual price level is lower than expected.
C) the unemployment rate is lower than the natural rate.
D) the actual output is more than the potential output.
E) the aggregate demand curve intersects the short-run aggregate supply curve at the potential output.
Correct Answer:
Verified
Q62: An expansionary gap is closed in the
Q67: If the expected price level exceeds the
Q73: Which of the following is true of
Q75: Which of these does not hold true
Q76: Which of the following if true would
Q79: The amount by which actual output falls
Q86: The figure below shows the short-run aggregate
Q87: The figure below shows equilibrium in an
Q90: The figure below shows the short-run aggregate
Q93: The figure below shows equilibrium in an
Unlock this Answer For Free Now!
View this answer and more for free by performing one of the following actions

Scan the QR code to install the App and get 2 free unlocks

Unlock quizzes for free by uploading documents