The figure below shows the short-run aggregate supply curve of an economy.In this figure,a recessionary gap would be represented by the distance between:
Figure 10.1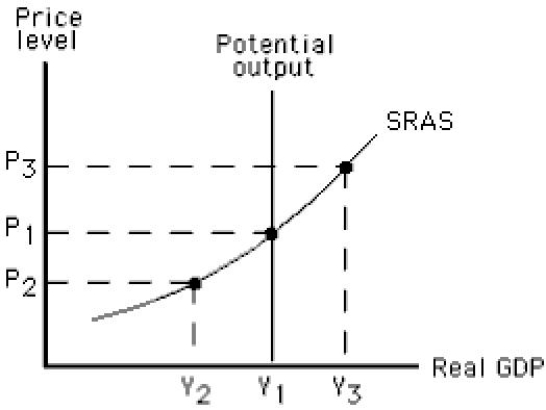
A) Y1and Y2.
B) Y1and Y3.
C) Y2and Y3.
D) P3and P1.
E) P3and P2.
Correct Answer:
Verified
Q66: If resource suppliers and demanders find out
Q73: Which of the following is true of
Q76: Which of the following if true would
Q79: The amount by which actual output falls
Q91: In the long run,a decrease in aggregate
Q97: The figure below shows the short-run aggregate
Q97: Which of the following is true in
Q100: The figure below shows the equilibrium in
Q101: The figure below shows short-run equilibrium in
Q102: The figure below shows the determination of
Unlock this Answer For Free Now!
View this answer and more for free by performing one of the following actions

Scan the QR code to install the App and get 2 free unlocks

Unlock quizzes for free by uploading documents