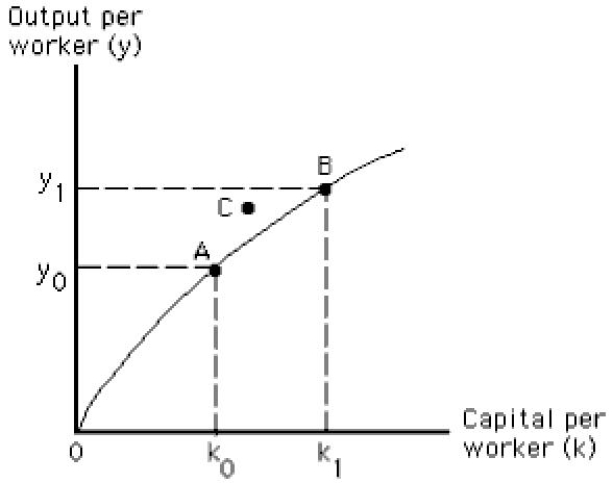
The figure below shows a per-worker production function.The bowed shape of the per-worker production function illustrates the law of diminishing returns to scale.
Figure 8.2
Correct Answer:
Verified
Q15: The figure below shows a per-worker production
Q20: The figure below shows a per-worker production
Q101: On-the-job experience causes labor productivity to increase
Q112: An increase in the production of capital
Q120: Human capital includes the machinery,equipment,and other manufactured
Q123: An increase in the amount of capital
Q127: The diminishing slope of the per-worker production
Q128: The process of adding more capital per
Q129: Between 1982 and 2002,U.S.GDP per capita grew
Q132: Productivity growth in the U.S.averaged approximately 3
Unlock this Answer For Free Now!
View this answer and more for free by performing one of the following actions

Scan the QR code to install the App and get 2 free unlocks

Unlock quizzes for free by uploading documents