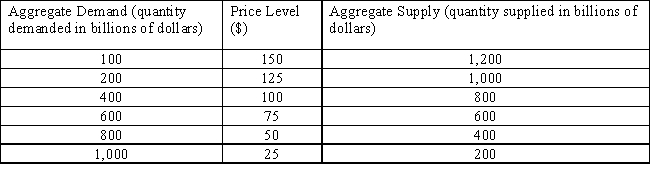
The following table shows an aggregate demand schedule and an aggregate supply schedule.Which of the following is true?
Table 5.1
A) Equilibrium output is $1,000,and equilibrium price level is 25.
B) Equilibrium output is $800,and equilibrium price level is 50.
C) Equilibrium output is $200,and equilibrium price level is 125.
D) Equilibrium output is $400,and equilibrium price level is 25.
E) Equilibrium output is $600,and equilibrium price level is 75.
Correct Answer:
Verified
Q61: Identify the most likely impact of a
Q63: Which of the following is most likely
Q67: For a given aggregate supply curve,an increase
Q68: Macroeconomic equilibrium is best described as a
Q69: Which of these describes the real gross
Q70: The laissez-faire approach popular before the Great
Q76: Economists use the price index to eliminate
Q77: Which of the following is the significance
Q78: If the U.S.price level increases relative to
Q80: Which of these is assumed to be
Unlock this Answer For Free Now!
View this answer and more for free by performing one of the following actions

Scan the QR code to install the App and get 2 free unlocks

Unlock quizzes for free by uploading documents