The table below uses adjusted data for the year 2000 provided by Statistics Canada.All values are in millions.Fill in the blank entries in the table. 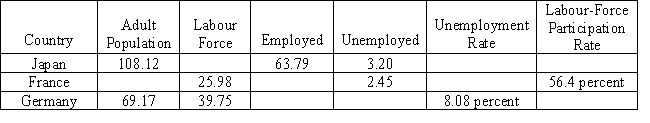
Correct Answer:
Verified
View Answer
Unlock this answer now
Get Access to more Verified Answers free of charge
Q181: Why might a favourable change to the
Q184: Consider an economy where population increases, which
Q185: A government agency provides labour data as
Q186: Suppose the market for landscape workers in
Q188: Teenage unemployment is higher than unemployment of
Q189: What is the theory of efficiency wages?
Q190: (Challenging) Draw a firm's labour demand curve
Q191: Cyclical unemployment and the natural rate of
Q193: Suppose the summer labour market for construction
Q194: In a labour demand and supply diagram,
Unlock this Answer For Free Now!
View this answer and more for free by performing one of the following actions

Scan the QR code to install the App and get 2 free unlocks

Unlock quizzes for free by uploading documents