Table 9-8
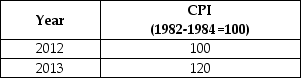
-Refer to Table 9-8.Suppose that the data in the table above reflect the price levels in the economy.What is the inflation rate in between 2012 and 2013?
A) 2%
B) 5%
C) 10%
D) 12%
E) 20%
Correct Answer:
Verified
Q145: A consumer price index of 160 in
Q162: The increase in quality bias in the
Q167: The consumer price index implicitly assumes that
Q169: Which of the following is the smallest
Q170: Your grandfather tells you that he earned
Q170: The broadest measure of the price level
Q171: Which of the following would be a
Q171: The most widely used measure of inflation
Q172: The Bureau of Labor Statistics has taken
Q179: Most economists believe that the biases in
Unlock this Answer For Free Now!
View this answer and more for free by performing one of the following actions

Scan the QR code to install the App and get 2 free unlocks

Unlock quizzes for free by uploading documents