In the graph below,the area between the lines AC and OB to the right of point E represents ________.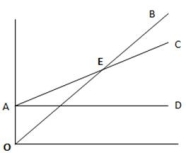
A) fixed costs
B) breakeven point
C) operating loss
D) operating income
Correct Answer:
Verified
Q102: Yarn Basket,Ltd.,sells hand-knit scarves.Each scarf sells for
Q105: Sensitivity analysis allows managers to see how
Q107: Dream Threads Company sells hand-sewn shirts for
Q110: From the graph given below,identify the sales
Q111: From the graph given below,identify the fixed
Q113: Metro Manufacturers produces flooring material.The monthly fixed
Q114: Hughes Company manufactures harmonicas which it sells
Q115: Khayyam Company,which sells tents,has provided the following
Q117: Identify the breakeven point in the graph
Q118: Explain the meaning of the operating loss
Unlock this Answer For Free Now!
View this answer and more for free by performing one of the following actions

Scan the QR code to install the App and get 2 free unlocks

Unlock quizzes for free by uploading documents