Use the following figure to answer the question : Figure 19-1 :
,the curve TT shows how the allocation of a resource affects the well-being of two individuals,Hank and Monica. 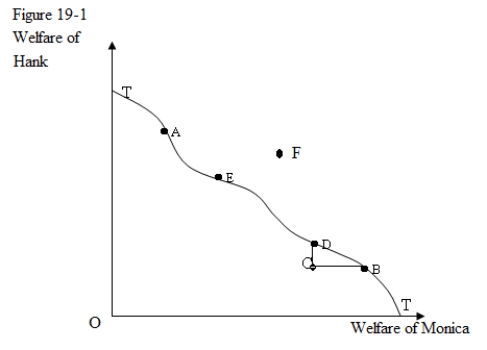
-In Figure 19-1,TT is referred to as:
A) the welfare frontier.
B) the production possibility frontier.
C) the marginal rate of transformation curve.
D) the community indifference curve.
Correct Answer:
Verified
Q1: A Pareto optimal allocation of resources implies
Q2: In which of the following situations would
Q3: Use the following figure to answer the
Q5: Assume that the price of steel rises
Q6: Which of the following is true of
Q7: Partial equilibrium analysis is the study of:
A)how
Q8: General equilibrium analysis is more appropriate than
Q9: Which of the following can be considered
Q10: An efficient distribution of a certain quantity
Q11: Which of the following assumptions are made
Unlock this Answer For Free Now!
View this answer and more for free by performing one of the following actions

Scan the QR code to install the App and get 2 free unlocks

Unlock quizzes for free by uploading documents