Use the following figure to answer the question : Figure 13-1 : shows the Stackelberg model of a duopoly.Both firms face constant marginal costs equal to OJ and the market demand curve is AD.The Stackelberg firm produces an output of OF and OF is equal to FL. 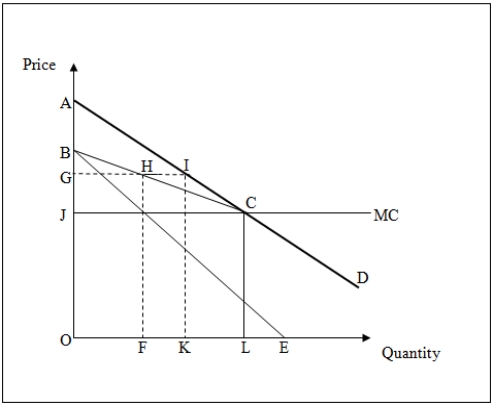
-Refer to Figure 13-1.The difference between the total industry output produced under a perfect competition model and a Stackelberg model is represented by the distance _____.
A) KF
B) KL
C) LE
D) FL
Correct Answer:
Verified
Q38: Which of the following is true of
Q39: Monopolistically competitive firms _.
A)earn positive economic profit
Q40: In Cournot's duopoly model,a firm's profit-maximizing level
Q41: In _,one firm uses its knowledge of
Q42: In the Stackelberg model of oligopoly,the leader
Q44: A _ shows the relationship between one
Q45: In the Stackelberg model,the leader firm's residual
Q46: Assume that there are only two full-service
Q47: The Stackelberg model is different from the
Q48: The residual demand curve shows:
A)the quantity that
Unlock this Answer For Free Now!
View this answer and more for free by performing one of the following actions

Scan the QR code to install the App and get 2 free unlocks

Unlock quizzes for free by uploading documents