Use the following figure to answer the questions :
Figure 7-2 shows the total product curve for different levels of a variable input,labor. 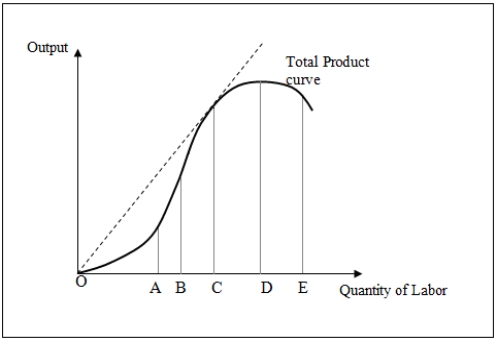
-When the labor input employed in production is between points O and C in Figure 7-2:
A) average product reaches a minimum.
B) marginal product reaches a maximum.
C) marginal product is below average product.
D) total product first increases at a decreasing rate and then increases at an increasing rate.
Correct Answer:
Verified
Q19: A carpenter hammers nails each day at
Q20: A carpenter hammers nails each day at
Q21: Use the following table to answer the
Q22: Use the following figure to answer the
Q23: Use the following figure to answer the
Q25: If the marginal product of a variable
Q26: Use the following figure to answer the
Q27: The average product of labor at a
Q28: Use the following figure to answer the
Q29: Use the following figure to answer the
Unlock this Answer For Free Now!
View this answer and more for free by performing one of the following actions

Scan the QR code to install the App and get 2 free unlocks

Unlock quizzes for free by uploading documents