The cost graphs in the illustration below shows various types of cost behaviors. 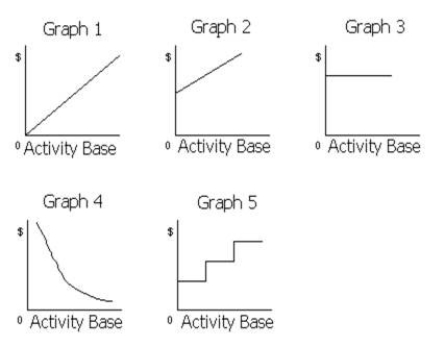 For each of the following costs, identify the cost graph that best describes its cost behavior as the number of units produced and sold increases:
a Sales commissions of $6,000 plus $0.05 for each item sold.
b Rent on warehouse of $12,000 per month.
c Insurance costs of $2,500 per month.
d Per-unit cost of direct labor.
e Total salaries of quality control supervisors.One supervisor must be added for each additional work shift.
f Total employer pension costs of $0.35 per direct labor hour.
g Per-unit straight-line depreciation costs.
h Per-unit cost of direct materials.
i Total direct materials cost.
j Electricity costs of $5,000 per month plus $0.0004 per kilowatt-hour.
k Per-unit cost of plant superintendent's salary.
l Salary of the night-time security guard of $3,800 per month.
m Repairs and maintenance costs of $3,000 for each 2,000 hours of factory machine usage.
n Total direct labor cost.
o Straight-line depreciation on factory equipment.
Correct Answer:
Verified
Q167: Given the following information:
Variable cost per unit
Q169: Use this information for Rusty Co. to
Q176: The manufacturing cost of Mocha Industries for
Q179: Copper Hill Inc.manufactures laser printers within a
Q183: Racer Industries has fixed costs of $900,000.Selling
Q192:
(a) If Swannanoa Company's budgeted sales are
Q193: For the current year ending April 30,
Q195: Gladstorm Enterprises sells a product for $60
Q202: For the coming year, River Company estimates
Q206: A company with a break-even point at
Unlock this Answer For Free Now!
View this answer and more for free by performing one of the following actions

Scan the QR code to install the App and get 2 free unlocks

Unlock quizzes for free by uploading documents