The figure shows a graph of the velocity of an object as a function of time.What is the average acceleration of the object over the following time intervals?
(a)From t = 0 s to t = 5.0 s
(b)From t = 0 s to t = 8.0 s 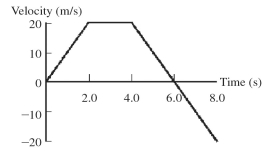
Correct Answer:
Verified
View Answer
Unlock this answer now
Get Access to more Verified Answers free of charge
Q132: To determine the height of a flagpole,Abby
Q152: The graph in the figure shows the
Q153: The graph in the figure shows the
Q154: The graph in the figure represents the
Q155: The figure shows the velocity-versus-time graph for
Q156: The graph in the figure shows the
Q159: The figure shows a graph of the
Q160: The graph in the figure shows the
Q161: The figure shows a graph of the
Q162: The figure shows a graph of the
Unlock this Answer For Free Now!
View this answer and more for free by performing one of the following actions

Scan the QR code to install the App and get 2 free unlocks

Unlock quizzes for free by uploading documents