The graph in the figure shows the velocity of a particle as it travels along the x-axis.What is the magnitude of the average acceleration of the particle between t = 1.0 s and t = 4.0 s? 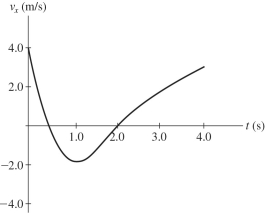
A) 0.33 m/s2
B) 1.7 m/s2
C) 2.0 m/s2
D) 2.5 m/s2
E) 3.0 m/s2
Correct Answer:
Verified
Q106: An astronaut stands by the rim of
Q107: An object is thrown upwards with a
Q125: Abby throws a ball straight up and
Q134: Abby throws a ball straight up and
Q136: An object is thrown upwards with a
Q143: The figure shows a graph of the
Q149: The figure shows a graph of the
Q151: The graph in the figure shows the
Q152: The graph in the figure shows the
Q153: The graph in the figure shows the
Unlock this Answer For Free Now!
View this answer and more for free by performing one of the following actions

Scan the QR code to install the App and get 2 free unlocks

Unlock quizzes for free by uploading documents