The figure shows the graph of the position x as a function of time for an object moving in the straight line (the x-axis) .Which of the following graphs best describes the velocity along the x-axis as a function of time for this object? 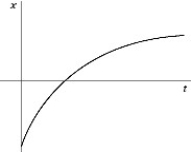
A) 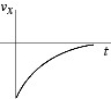
B) 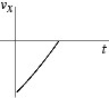
C) 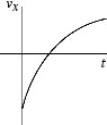
D) 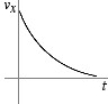
E) 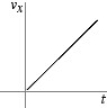
Correct Answer:
Verified
Q17: When can we be certain that the
Q24: Arthur and Betty start walking toward each
Q32: If the fastest you can safely drive
Q43: Approximately how many times does an average
Q53: An object starts its motion with a
Q54: The figure shows a graph of the
Q55: A cat runs along a straight line
Q58: The mass of a typical adult woman
Q59: The figure represents the position of a
Q94: Estimate the number of times the earth
Unlock this Answer For Free Now!
View this answer and more for free by performing one of the following actions

Scan the QR code to install the App and get 2 free unlocks

Unlock quizzes for free by uploading documents