Refer to Figure 15.2 for the following questions.
Figure 15.2 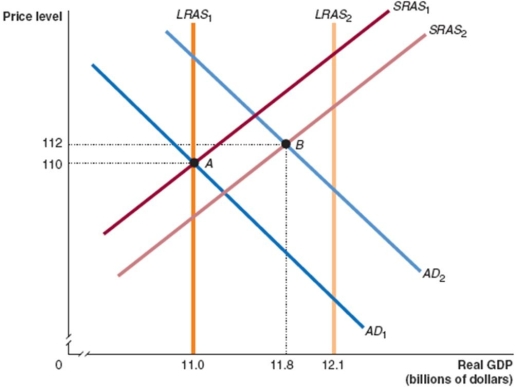
-In Figure 15.2,given the economy is at point A in year 1 and point B in year 2,what is the growth rate in potential GDP between those two years?
A) 9.1 per cent
B) 8 per cent
C) 12 per cent
D) 10 per cent
Correct Answer:
Verified
Q81: Starting from long-run equilibrium, use the basic
Q84: Which of the following is an assumption
Q85: When the short-run aggregate supply curve and
Q92: Which of the following is not an
Q94: Beginning at long-run equilibrium, (i)use the basic
Q96: What is the relationship among the AD,
Q107: In the dynamic aggregate demand and aggregate
Q119: After an unexpected increase in the price
Q136: Refer to Figure 15.2 for the following
Q137: Refer to Figure 15.2 for the following
Unlock this Answer For Free Now!
View this answer and more for free by performing one of the following actions

Scan the QR code to install the App and get 2 free unlocks

Unlock quizzes for free by uploading documents