Refer to Figure 15.2 for the following questions.
Figure 15.2 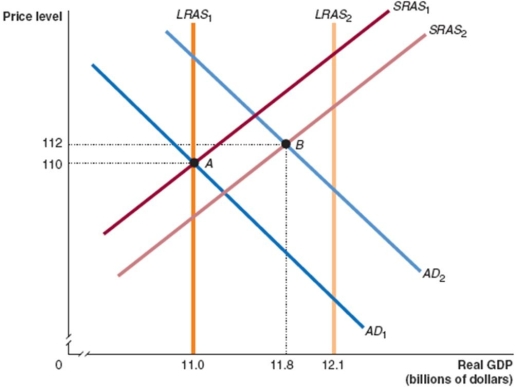
-In Figure 15.2,given the economy is at point A in year 1 and point B in year 2,what is the growth rate in real GDP between those two years?
A) 2.5 per cent
B) 7.3 per cent
C) 8.0 per cent
D) 10.0 per cent
Correct Answer:
Verified
Q78: Which of the following correctly describes the
Q85: When the short-run aggregate supply curve and
Q89: Explain how the economy moves back to
Q92: Which of the following is not an
Q114: In the dynamic aggregate demand and aggregate
Q121: Refer to Figure 15.2 for the following
Q202: At a long-run macroeconomic equilibrium,real GDP is
Q204: Stagflation occurs when short-run aggregate supply decreases.
Q213: An increase in government spending will result
Q240: What is a supply shock,and why might
Unlock this Answer For Free Now!
View this answer and more for free by performing one of the following actions

Scan the QR code to install the App and get 2 free unlocks

Unlock quizzes for free by uploading documents